Current Location:Home>Product & Technology>Atmospheric Pollution Monitoring>NOx/O3/TVOC monitoring station
NOx/O3/TVOC monitoring station
The Cambri NOx/O3/TVOC monitoring station offers a compact solution for studying ozone-related chemistry by simultaneously measuring concentrations of O3 and its major precurssors, NOx and TVOC, and local meteorological parameters. It can be jointly deployed with our summa canister air sampler, which can be remotely controlled to obtain whole air samples, for lab identification and quantification of component VOCs to better understand detailed, local photochemical processes.
- Product Parameters
- Product Quality Control
- Product Advantages

Photoionization TVOC Sensor

● Owing to their low noises, TVOC sensors based on the photoionization detection (PID) can have superior sensitivities with their measurement precision reaching down to 1 ppb or lower levels. However, in the field environment, especially that with high relative humidities, raw signals of this type of sensors are often temperature and relative humidity (RH) induced drifts rather than that from VOC photoionization - this is best shown by the grey curve corresponding to the raw signal readings of the "ordinary" PID sensor in the above lower figure, most notably at RH > 80% when the sensor output voltage rose simultaneously and non-linearly with the increase of RH;
● Our patented technique however suppresses the temperature and RH induced sensor drifts, thereby decoupling the trend of the sensor raw reading and those of temperature and RH, as shown by the red curver in the above lower figure for the "modified" TVOC sensor;

Furthermore, we compared the TVOC concentration (isobutylene equivalent) measured by the photoionization detector with the weighted concentration of VOC components based on gas chromatography-flame ionization detector (GC-FID) (calculated according to the response coefficients of VOCs to 10.6 eV photoionization, PID Correction Factors), and the results are shown in the figure above.
●Both methods show good consistency in both the low concentration range (10-20 ppb) and the high pollution range (>200 ppb), indicating that the PID sensor can accurately monitor TVOC concentrations in varying outdoor temperature and RH conditions;
● We believe it is fair to claim that measurement results by the PID sensors have effectively eliminated the impacts of temperature and RH, and therefore can avoid the unrealistic, high reading values under high-humidity conditions. Meanwhile, sensor measurements have higher temporal resolution and can capture VOC concentration change in seconds;
● Our selected sensors have sensitivity loss of < 20% after > 1 year continous running in the moderately polluted industrial park environment (peak TVOC concentration > 400 ppb), suggesting that the sensors are resistant towards pollution and have stable UV lamp outputs across this time scale.
Accurate data
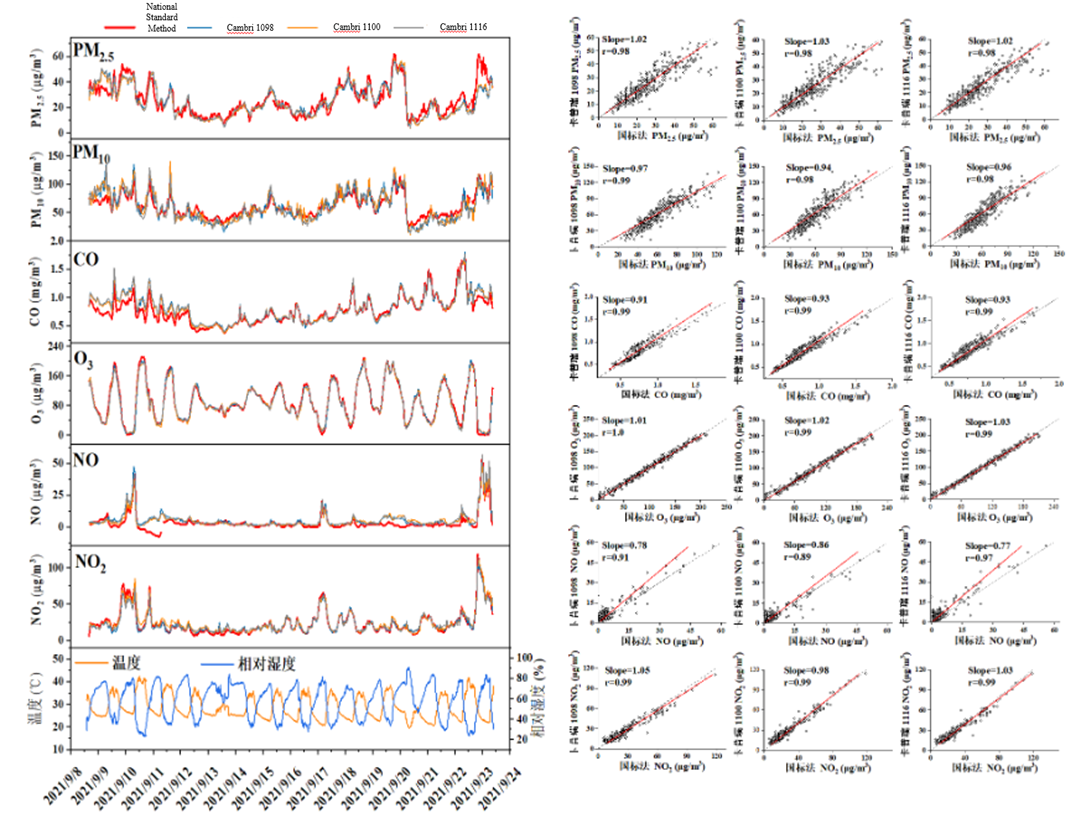
Sep.2021, sewage treatment plant in XX city, Jiangsu.
We have deployed three atmospheric environment monitoring micro station (numbered as 1098, 1100 and 1116) and compared their data with standard device using Federal Reference Methods. Parameters include typical atmospheric pollutants like PM10, PM2.5, CO, NO2, O3 and NO. The temperature and relative humidity intervals are 23.5~43.6 ℃, 15.9% ~ 100% RH.
As shown in the figure above, three micro stations produce data highly matched stand device’s data. The correlation coefficient on PM2.5, PM10, O3, NO2, CO both exceed 0.98, while the coefficient on NO is around 0.9. Note that the NO data produced by standard device on Sep.10th-11th are inaccurate with negative readings.

Analyses show that micro stations can operate effectively across a range of temperatures and humidities. The data from all three micro stations closely align with those from standard stations, exhibiting a near-perfect correlation for both particulate matter and ozone.

As shown in the figure above, the average value, median, lower and upper percentile of pollutant concentration are very similar between micro station and standard device, which proves that micro station could accurately measure the overall pollution condition.
This device is capable of measuring 8 typical air pollutants (PM1, PM2.5, PM10, CO, NO2, SO2, O3 and CO2), 2 important photochemical and/or secondary aerosol precursors (NO and TVOC), 7 meteorological parameters (air temperature, relative humidity, atmospheric pressure, wind speed, wind direction, illumination and rainfall intensity), and environmental noise (Lp(A,C,Z), Leq, LN (5, 10, 50, 90, 95…), Lmax, Lmin, SD, Ld, Ln and noise spectrum, all at class 1 compliant level) simultaneously.
When equipped with high-performance edge computing chips, device can also run neural network based auto-recognition of the type of the recorded excessive noise clips (categorized into e.g. vehicle passage noise, vehicle horn, construction site noises, and natural sounds such as wind, insects chirping or birds singing etc.), as well as calculate noise annoyance level.
Other features
● 4G wireless data transmission to cloud database, followed by processing, analysis and visualization of measurement data on dedicated client data platform;
● Internal memory can store >1 year of measurement data when wireless connection is lost, which are then uploaded to the server when the connection is resumed;
● Data quality control (QC): we maintain a professional data QC team and a well-established QC system, to ensure high standards of data quality and timely reply to any customer inquiries.